

A Trading System For TQQQ
- Subscribe to my YouTube Channel HERE.
I'm fascinated by TQQQ.
And I can't stop being fascinated.
On almost every test, it beats the market by a wide margin. It even beats trading contest superstars without any fancy rules.
But as you may know, I sold out of my TQQQ position recently for an 84% gain.
Why?
I'm concerned about the imminent Bear Market (like everyone else). 2022 was bad for TQQQ. It recovered but it was a bad drop.
The worst news, though, is that there isn't any data on TQQQ for the worst bearish times. Its chart only goes back to 2010, and that obviously doesn't include 2008 or 2000-2002.
How bad would it have been for TQQQ in those two calamities? Very.
Estimates show that TQQQ would've dropped about 90% in 2008 and about 99% during the Dot Com Crash.
And I don't want any part of that.
So, what do I do then? Just forget about TQQQ forever? It seems like such a waste.
This ETF has massive runs, and there should be a way for us to capture some of that.
One possible way was to use The Incredible System on it. That's a system on a monthly chart that does a good job of getting in and out. It's on a monthly chart, though, which isn't acceptable for many traders.
So let's try to take the principles of The Incredible System and put them on a Daily chart.
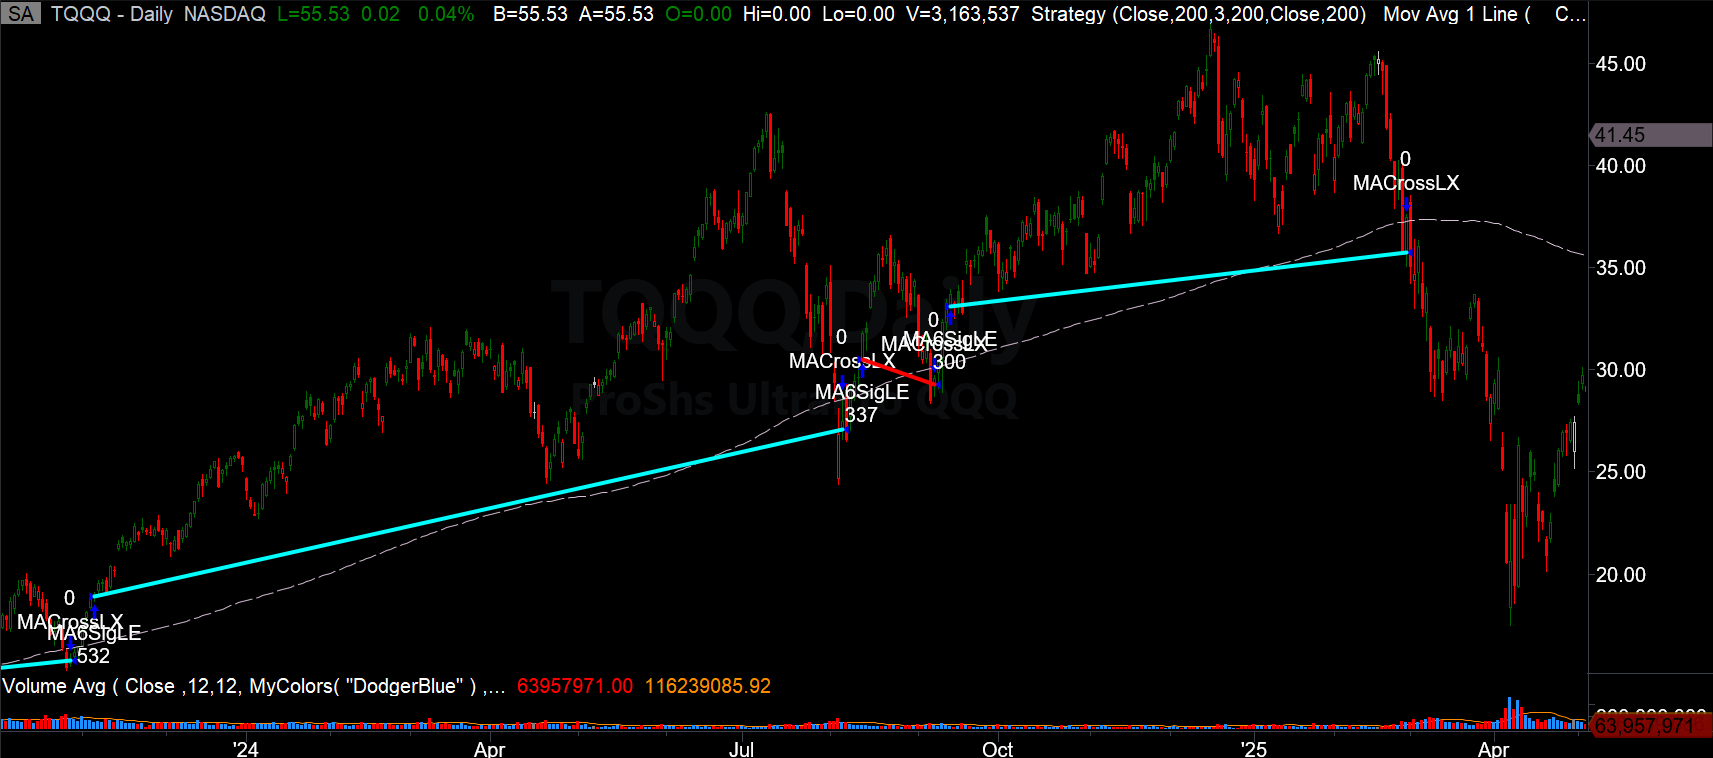
Here are the rules for the Daily Incredible System
- Enter Long when TQQQ closes above its 200-day simple moving average for 3 consecutive days.
- Exit when TQQQ closes below the 200 SMA.
And that's it. Here are a few trades:
Theoretically, getting out using a filter should keep us out of the horrible potential drawdowns.
Let's see if that's true.
Here's the Report from 2010-2025 trading $10k of stock each time:
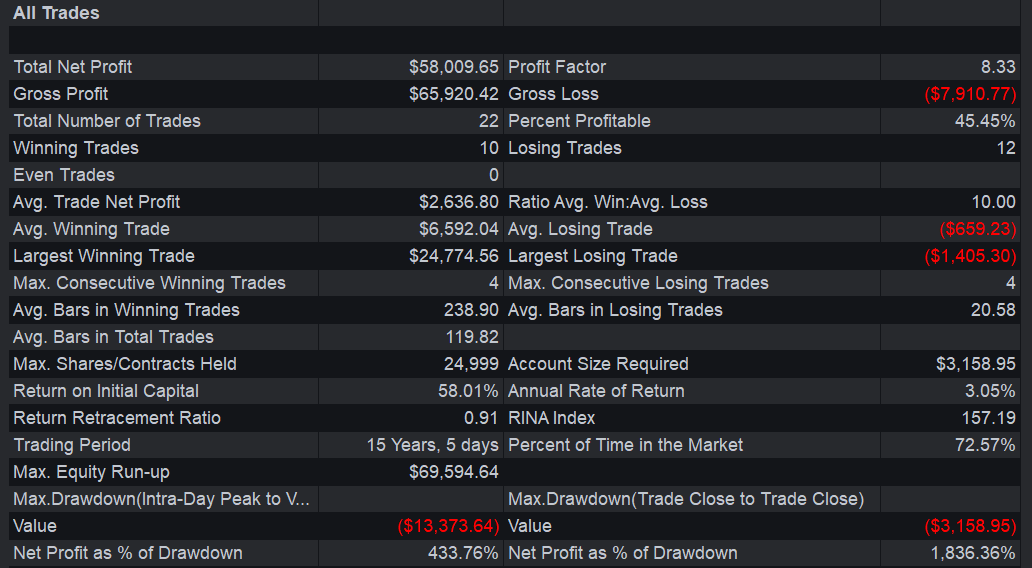
It's done well. The max drawdown number isn't legitimate because it includes the peak-to-trough pullbacks on profitable trades. For example, the biggest drawdown might be listed as $13k but that occurred when we were $30k in profit but only ended up making $17k. So I ignore max drawdown for the most part in systems like this.
The close-to-close drawdown matters more and it's only 31% in this system.
That's a whole lot better than 90%.
And this Report doesn't include compounding.
Here's the Curve since 2010:
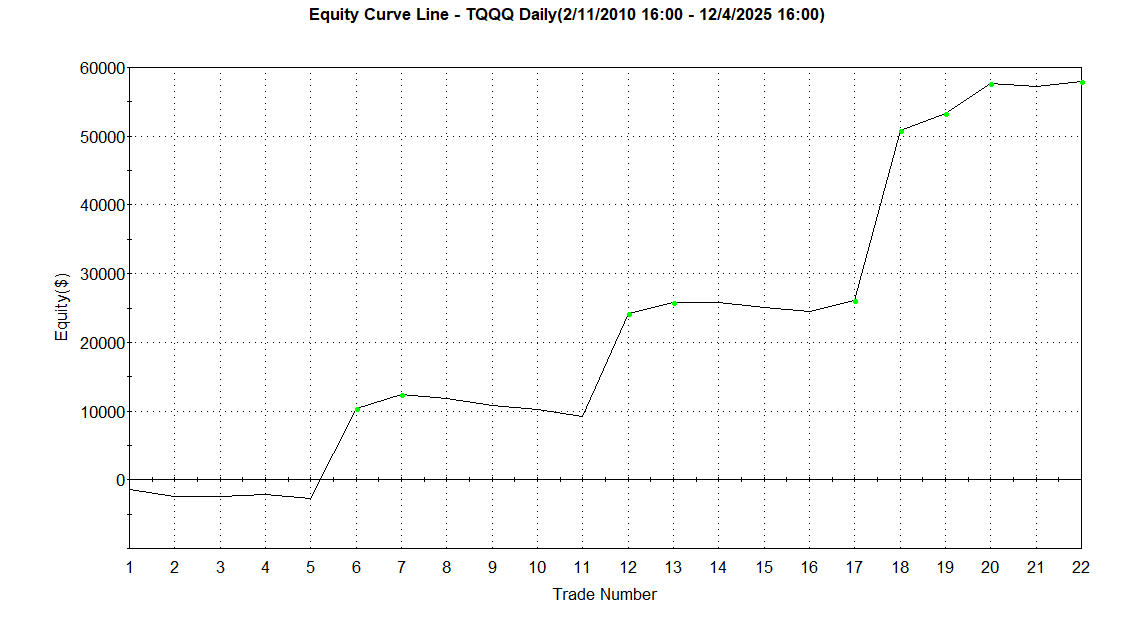
That's a very nice Equity Curve and it does show that a system like this can keep TQQQ out of its worst drawdowns.
Here's the current market and the current winning trade this system is in:

It's nicely in profit and isn't close to an exit right now.
Overall, this system definitely has my attention.
Talk to you soon.
DISCLAIMER: This is not financial advice.
It should not be assumed that the methods, techniques, or indicators presented in these videos will be profitable or that they will not result in losses. Past results are not necessarily indicative of future results. Examples presented are for educational purposes only. These set-ups are not solicitations of any order to buy or sell. The authors, the publisher, and all affiliates assume no responsibility for your trading results. There is a high degree of risk in trading. HYPOTHETICAL OR SIMULATED PERFORMANCE RESULTS HAVE CERTAIN INHERENT LIMITATIONS. UNLIKE AN ACTUAL PERFORMANCE RECORD, SIMULATED RESULTS DO NOT REPRESENT ACTUAL TRADING. ALSO, SINCE THE TRADES HAVE NOT ACTUALLY BEEN EXECUTED, THE RESULTS MAY HAVE UNDER- OR OVER-COMPENSATED FOR THE IMPACT, IF ANY, OF CERTAIN MARKET FACTORS, SUCH AS LACK OF LIQUIDITY. SIMULATED TRADING PROGRAMS IN GENERAL ARE ALSO SUBJECT TO THE FACT THAT THEY ARE DESIGNED WITH THE BENEFIT OF HINDSIGHT. NO REPRESENTATION IS BEING MADE THAT ANY ACCOUNT WILL OR IS LIKELY TO ACHIEVE PROFITS OR LOSSES SIMILAR TO THOSE SHOWN.

