

This PPP Pullback Strategy Keeps Performing
- Subscribe to my YouTube Channel HERE.
If you're looking for long-term viability with your trading and not short-term fun, a great thing to do is to trade indexes.
Yes, everyone wants to have a system that trades Long on NVDA for the past few years.
But growth stocks change. Individual stocks tumble.
And unless the system goes Long and Short on an instrument that can actually produce profit both Long and Short, putting all your eggs in one volatile basket isn't great for long-term survival.
Which, again, is a big reason to trade indexes.
As you probably know, a few years ago I set out to create a portfolio of automated trading systems that would never have to be optimized.
And I track that portfolio each month on my Performance Page. (Not surprisingly, this portfolio is called the Performance Page Portfolio, or PPP.)
The first system I created for that portfolio was on the ES (E-Mini) Futures contract. It's the S&P 500 but with leverage.
I wanted it on the Daily chart to filter out the noise, and I wanted it to use one of my favorite indicators, the RSI.
Specifically, I wanted it to use the RSI 2 methodology. This simply means I wanted the length of the RSI set to 2. Why?
Because over the long haul, RSI 2 seems to work very well.
Last, I wanted price action to determine the exit, not a set stop. Why is this good? It allows us to win bigger when the market is moving more. And it gets us out at a reasonable spot (hopefully) after a pullback. If we get into a bad position, the RSI will get us out of that difficulty as soon as we get some short-term momentum.
All told, here is the strategy:
PPP RSI Daily Strategy (for ES)
- Use a Daily chart.
- RSI length set to 2.
- Overbought set to 70. Oversold set to 10.
- Price must be above the 100-day SMA to take a trade.
- This system is Long Only.
Here are a few recent trades:
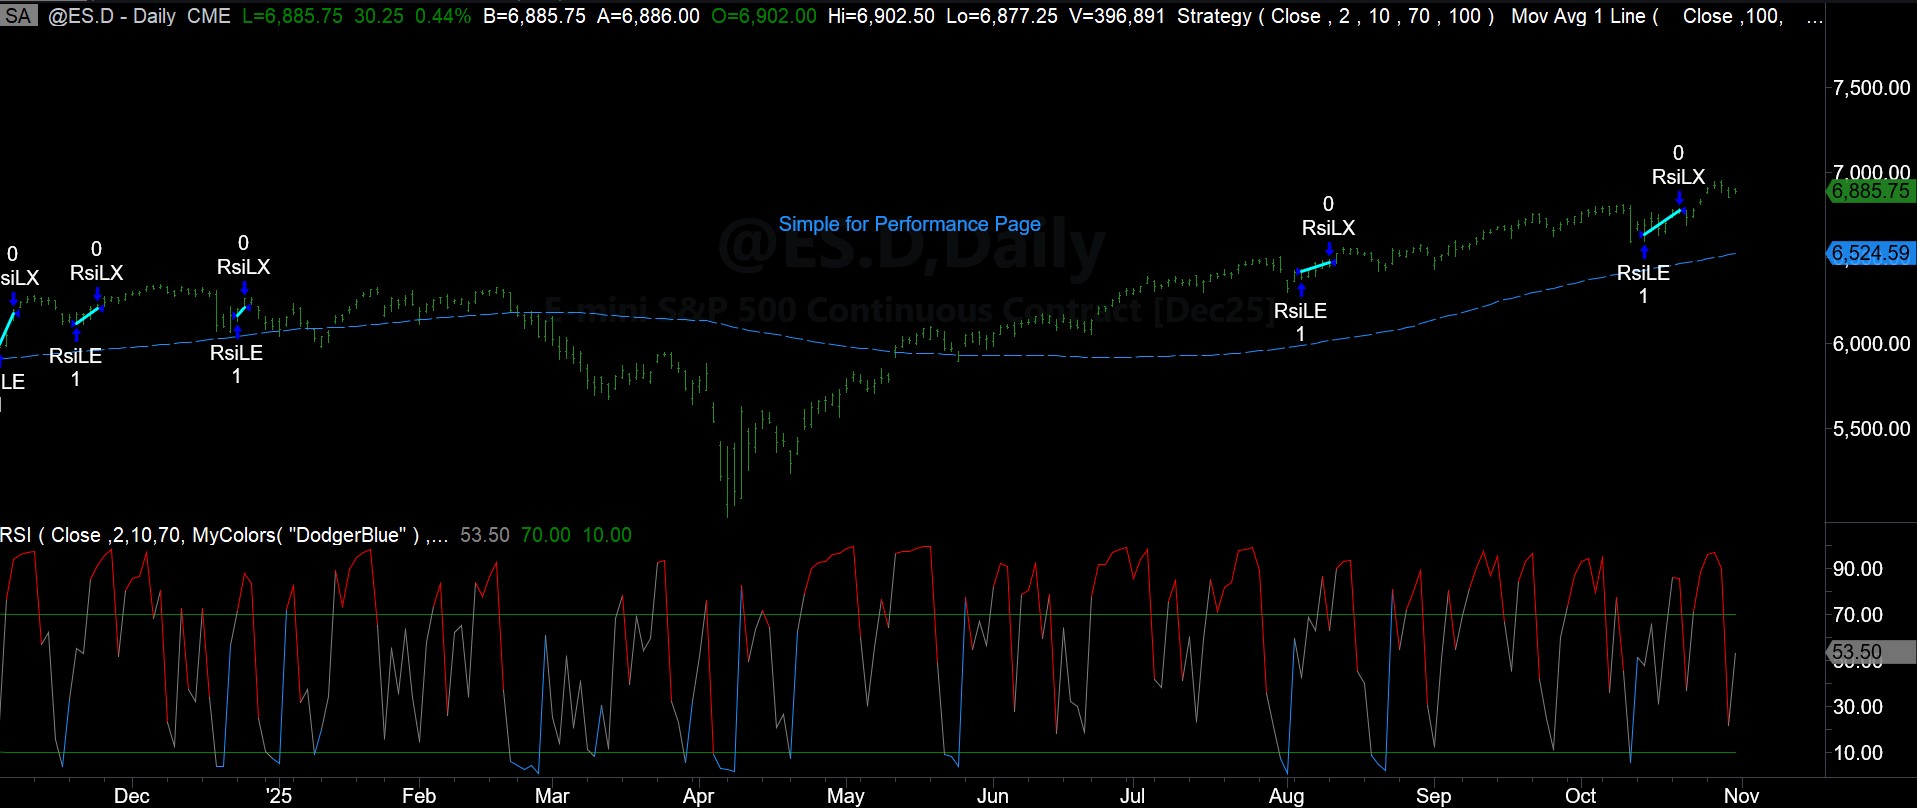
Despite all the volatility, 2025 has been a great year for this system.
And here's the Curve since 1998:
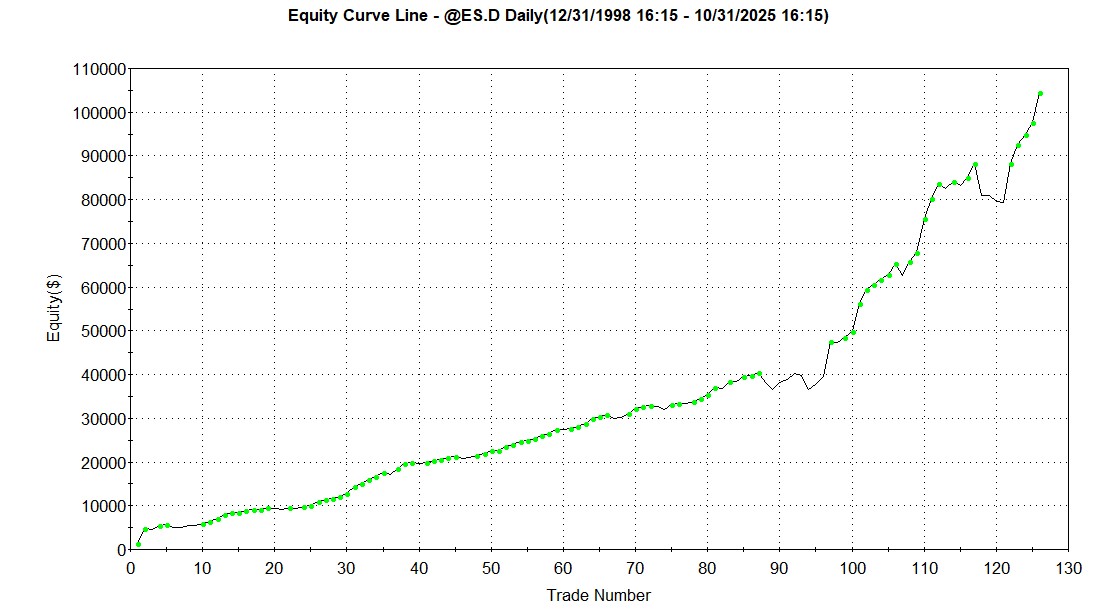
That looks really good.
Here's the Report:
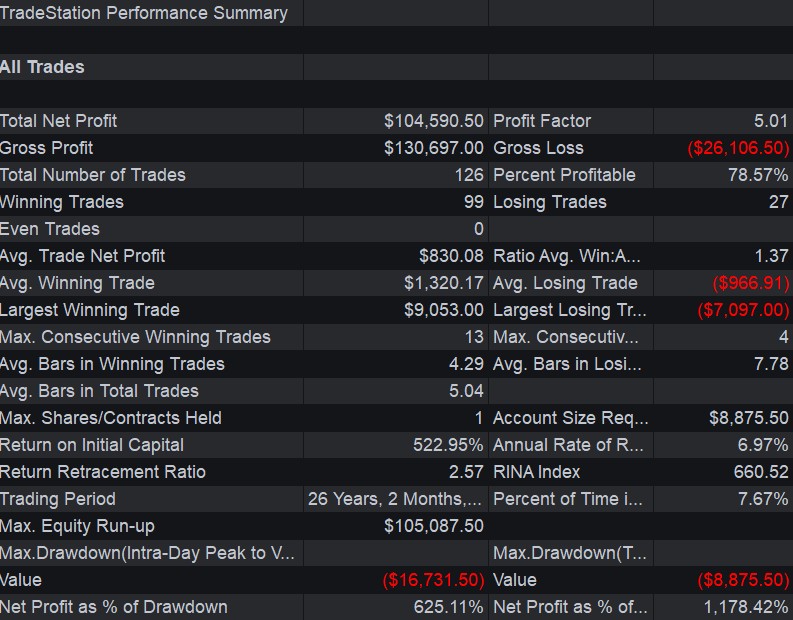
It has a great Profit Factor and also has a 78% win rate.
Most remarkably, though, this system thrives during really bad times for the stock market. Here are the Annual Returns during the Dot-Com Crash of 2000-2003:

And here's 2007-2017
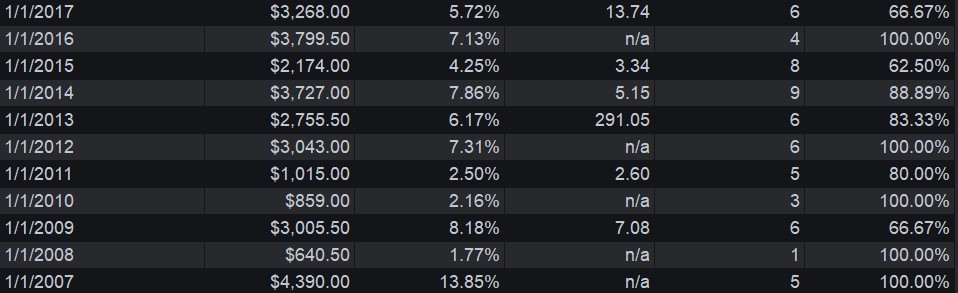
It was profitable overall during one of the worst crashes in history (2000-2003) and didn't lose money in 2008, which is crazy.
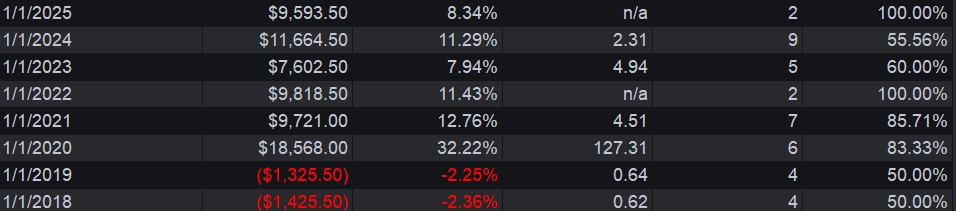
The only drawback is that this system had small losing years in 2018-19. But it came roaring back and hasn't lost since:
Overall, this looks like something that could be traded over many years, and could make a good addition to a bigger portfolio.
It's given a nice foundation to the Performance Page Portfolio.
Talk to you soon.
DISCLAIMER: This is not financial advice.
It should not be assumed that the methods, techniques, or indicators presented in these videos will be profitable or that they will not result in losses. Past results are not necessarily indicative of future results. Examples presented are for educational purposes only. These set-ups are not solicitations of any order to buy or sell. The authors, the publisher, and all affiliates assume no responsibility for your trading results. There is a high degree of risk in trading. HYPOTHETICAL OR SIMULATED PERFORMANCE RESULTS HAVE CERTAIN INHERENT LIMITATIONS. UNLIKE AN ACTUAL PERFORMANCE RECORD, SIMULATED RESULTS DO NOT REPRESENT ACTUAL TRADING. ALSO, SINCE THE TRADES HAVE NOT ACTUALLY BEEN EXECUTED, THE RESULTS MAY HAVE UNDER- OR OVER-COMPENSATED FOR THE IMPACT, IF ANY, OF CERTAIN MARKET FACTORS, SUCH AS LACK OF LIQUIDITY. SIMULATED TRADING PROGRAMS IN GENERAL ARE ALSO SUBJECT TO THE FACT THAT THEY ARE DESIGNED WITH THE BENEFIT OF HINDSIGHT. NO REPRESENTATION IS BEING MADE THAT ANY ACCOUNT WILL OR IS LIKELY TO ACHIEVE PROFITS OR LOSSES SIMILAR TO THOSE SHOWN.

